Fertilizer Big Data: First Half of 2016 Fertilizer Raw Material Market Analysis
It's that time of year again to write the half-year summary. How did the markets for major fertilizer products perform in the first half of 2016? Read on and this article will walk you through it.

Synthetic Ammonia Market Summary
Looking back on how synthetic ammonia got through these past six months, I can't help but recall a post I saw on WeChat Moments a few days ago: if you didn't reach your expected goals in the first half of the year, don't be disappointed and don't lose heart, because the Party was founded on July 1, the Army was founded on August 1, and the Nation was founded on October 1 - great undertakings are all accomplished in the second half of the year! This humorous remark probably voices the sentiments of many people in the fertilizer industry!
If one had to sum up the first half of synthetic ammonia in a single phrase, it would be "full of twists and turns." Although the twists were considerable, they ultimately could not stop the overall downward trend.
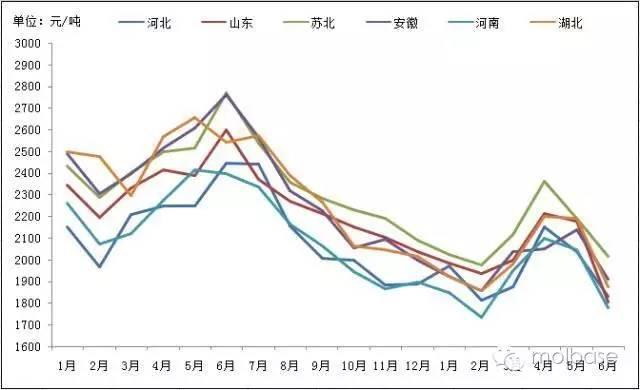
Synthetic ammonia regional price trend chart from 2015 to present
From Figure 1, it is clear that the price gap for synthetic ammonia between 2015 and 2016 was relatively large, with the gap between high-end and low-end prices reaching 1030 yuan/ton, and the overall trend followed a pattern of "3 falls and 2 rises." Both low-end prices occurred around February. In terms of the year-on-year price gap between the two years, the average price in February 2016 decreased by 336 yuan/ton compared with the previous year, down 16.22% year-on-year. The high-end prices during the two years appeared in June and April respectively. Last year's high-end monthly average price was 410 yuan/ton higher than this year's, down 14.8% year-on-year.
However, in the first half of this year, synthetic ammonia prices had only one prominent "little hill." Starting in February, after two months of increases, prices have fallen sharply from April to now. Judging from last year's overall trend, it could not provide support for this year's synthetic ammonia prices. From the chart, it can be seen that from June 2015 to February 2016, synthetic ammonia prices declined all the way without any sign of recovery. Based on this trend, this year's high-end price may remain at the April level. According to Longzhong data, Hebei liquid ammonia has become the lowest price point in nearly 3 years since 2014, and as of July the market still shows no improving trend. The outlook for synthetic ammonia in the second half of the year is not optimistic.
1 Producers carry out maintenance but supply does not decrease
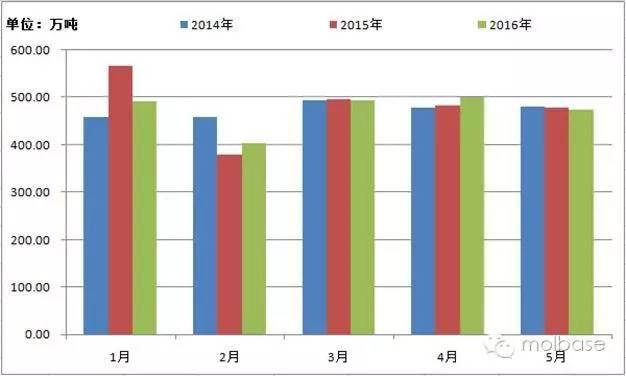
Statistics on domestic synthetic ammonia supply from January to May 2014-2016
The supply volume in Figure 2 is the sum of monthly output and monthly imports. From the trend chart, it can be seen that supply generally fluctuates more in the early months of the year, and from March onward supply gradually stabilizes. Although June data has not yet appeared, we can predict from historical trends that it will be around 4.85 million tons, down about 1.6% from 4.93 million tons in the same period of 2015.
Throughout the first half of the year, although many producers carried out long-term or short-term maintenance, it seemed that overall market supply should have declined somewhat. However, aside from some co-production enterprises also releasing ammonia at irregular intervals, on the import side, synthetic ammonia imports in 2016 became the highest for a first half in nearly 3 years. From January to May this year, synthetic ammonia imports reached 173,400 tons, up 10.8% from 156,500 tons in the same period last year, and up sharply by 114% from 81,000 tons in 2014. Under the influence of multiple factors, the overall supply in the synthetic ammonia market was therefore little different from previous years.
2 Downstream operating rates remain low with no demand growth, apparent consumption declines again after a gap year
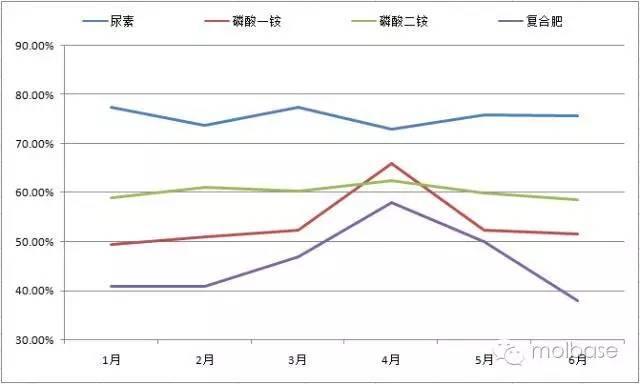
Trend chart of downstream product operating rates for synthetic ammonia from January to June 2016
To understand how the fertilizer market performed overall in the first half of the year, Figure 3 will roughly make it clear. Urea, phosphate ammonium and compound fertilizer are all downstream industries of synthetic ammonia and are also traditional bulk fertilizer products. In the first 6 months of 2016, no product operated at full capacity. Among them, urea had the highest operating rate, basically fluctuating around 75%; next was diammonium phosphate, stable at around 60%; after that, monoammonium phosphate and compound fertilizer showed relatively similar operating trends, with basically consistent fluctuation frequency, both peaking in April at 65% and 58% respectively. But in terms of low operating rates, monoammonium phosphate had its lowest operating rate in January at 50%. Taking compound fertilizer as an example, for most of the first half its operating rate was below half, with the lowest in June at around 38%. With such low operating rates, how could the raw material market operate normally? Selling at reduced prices seemed to become one of the solutions.
On the other hand, apparent consumption in the first half of 2016 declined compared with last year. From Figure 4, it is not hard to see that the growth rate of synthetic ammonia apparent consumption was not impressive. From 2012 to 2014, the growth rate declined all the way, edged up slightly in 2015, but was revised down again in 2016. This performance also indicates that downstream demand is weakening, and synthetic ammonia consumption is gradually shrinking.
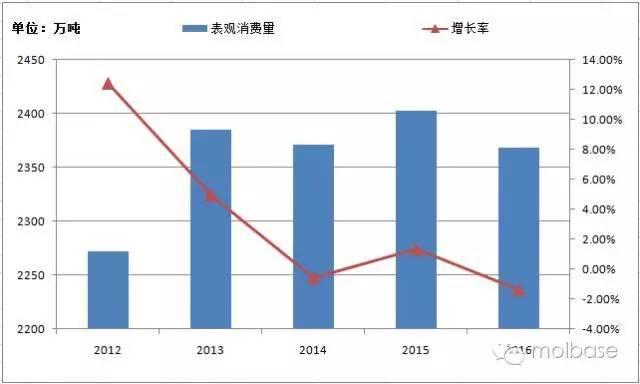
Statistics on domestic synthetic ammonia apparent consumption from January to May 2012-2016
3 How will the market move in the second half? Synthetic ammonia's little mood swings may be hard to settle
To sum up the synthetic ammonia market in the first half of the year, after experiencing bottom-finding, a rebound after touching bottom, and a transition through a stable period, it also welcomed a "cool" summer. How will this autumn and winter pass? Synthetic ammonia will probably continue to throw its "little moods." A continued surge is basically impossible, and avoiding a sharp decline may be the best result that producers can hope for. Affected by autumn fertilizer preparation, a slight recovery is possible, but due to severe natural weather such as heavy rainstorms and floods in the south, delays in enterprise production and end-user fertilizer preparation are inevitable. Therefore, in the short term, people in the synthetic ammonia industry will probably have to accept the weak market with tolerance, while still holding on to a glimmer of hope, because after all, "the great undertaking for synthetic ammonia in the second half of the year" still requires everyone's joint efforts.
Phosphate Ammonium Products Market Summary
2016 is already more than half over. In the first half, the monoammonium phosphate and diammonium phosphate markets did not flourish as they did last year, but instead continued to probe downward amid stumbling conditions. Due to the sluggish overall economic environment, a sharp drop in export volumes, low grain prices and low planting enthusiasm, and cautious buyer sentiment, the trading atmosphere in the phosphate ammonium market continued to fade, and the center of transaction prices kept declining. As of now, the mainstream ex-factory quote for 55% powdered monoammonium phosphate is 1600-1700 yuan/ton, with actual transactions around 1600 yuan/ton, mainly on a case-by-case basis; the mainstream ex-factory price for 64% diammonium phosphate is 2150-2200 yuan/ton, with actual transaction prices possibly another 100 yuan/ton lower, and mostly pending settlement. Compared with the beginning of the year, this price level represents a decline of 320-350 yuan/ton.
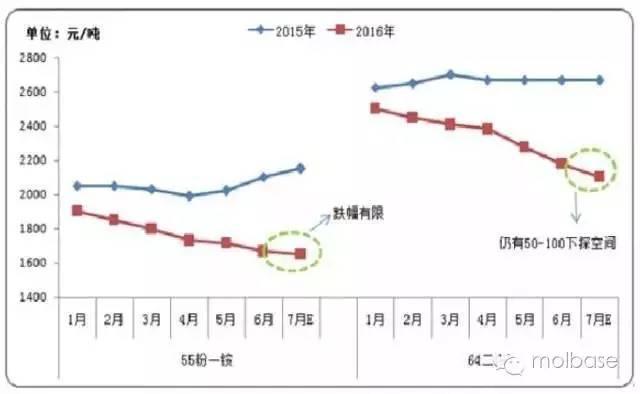
Comparison chart of monthly average domestic ex-factory price trends for monoammonium phosphate and diammonium phosphate from 2015 to 2016
At present, the domestic phosphate ammonium market as a whole is in the off-season for sales. Downstream compound fertilizer operating rates are low (40-50%), and with autumn fertilizer preparation still some time away, enthusiasm for purchasing the raw material monoammonium phosphate is not high; agricultural materials dealers are cautious in their purchasing mentality, the future market is unclear, and fearing large capital occupation, they dare not rashly stock up large inventories. Market transaction volumes are tiny. The price of powdered monoammonium phosphate has basically bottomed out, while diammonium phosphate is under pressure from low prices and may still have room to probe lower later.
International phosphate ammonium price trend chart for the first half of 2016
In the first half of the year, international phosphate ammonium market prices also continued to decline, mainly because last year's phosphate ammonium import volume was too large and inventories were high, while Middle Eastern countries such as Saudi Arabia and Oman have low-cost new-process plants, which under their price advantage pressured China's export prices. As of the end of June, Baltic monoammonium phosphate FOB was 335-340 USD/ton, down 40 USD/ton from the early-year high of FOB 375-380 USD/ton; diammonium phosphate FOB China was 330-333 USD/ton, down 60-67 USD/ton from 390-400 USD/ton at the beginning of the year; Indian diammonium phosphate CFR was 340-345 USD/ton, also continuing its downward trend, down 65-68 USD/ton from 408-410 USD/ton at the beginning of the year.
So, under the bearish influence of sharply reduced domestic and international demand and prices continuing to fluctuate at low levels, how will diammonium phosphate trend later? Can the diammonium phosphate market regroup in the second half of the year? The author provides a brief analysis through the following aspects.
1 Phosphate ammonium output in the first half was stable with some increases and decreases
Comparison chart of monoammonium phosphate and diammonium phosphate output from January to May 2015-2016
From the chart above, it is clearly visible that from May 2015 to May 2016 there were no obvious large fluctuations in phosphate ammonium output. Monoammonium phosphate output rose, while diammonium phosphate output was basically the same. From January to May, total monoammonium phosphate output was about 9.236 million tons, an increase of about 400,000 tons over the same period last year; total diammonium phosphate output was about 7.788 million tons, a slight reduction of about 62,300 tons from 7.8503 million tons in the same period last year. June is the traditional off-season for sales, and coupled with poor export orders, enterprises shut down plants or reduced output considerably. Monoammonium phosphate and diammonium phosphate output are estimated to decrease by 100,000-200,000 tons each.
2 Phosphate ammonium export volumes fell significantly in the first half
Comparison chart of monoammonium phosphate and diammonium phosphate export volumes from January to May 2015-2016
From January to May 2016, total monoammonium phosphate exports were about 621,800 tons, a sharp reduction of 552,600 tons from 1.1744 million tons in the same period last year, a decline of about 47.05%. Among this, monoammonium phosphate exports in February were only 33,300 tons, and June exports are estimated to be around 30,000 tons; from January to May 2016, total diammonium phosphate exports were about 1.3741 million tons, a decrease of about 748,700 tons from 2.1228 million tons in the same period last year, a decline of 35.27%. Local phosphate ammonium output in Morocco, Pakistan and India increased, and with large inventories, import volumes shrank. Coupled with advanced processes and low costs at some newly added plants in the Middle East, Chinese supply came under pressure on both volume and price, leading to reduced exports.
Detailed table of the largest export destination countries for monoammonium phosphate and diammonium phosphate in 2015-2016
Brazil and India are China's largest export destinations for monoammonium phosphate and diammonium phosphate. Among this, annual monoammonium phosphate exports to Brazil account for about 58% of total exports; annual diammonium phosphate exports to India account for about 54% of total exports. In each month of 2016, the quantities of monoammonium phosphate and diammonium phosphate exported to Brazil and India declined sharply. As of May, exports of monoammonium phosphate and diammonium phosphate to Brazil and India had decreased by about 400,000-440,000 tons.
3 Profit margins at phosphate ammonium plants fell sharply
Trend chart of profit and cost for 55% powdered monoammonium phosphate at mainstream plants in Hubei in the first half of 2016
Taking the Hubei region as an example, by calculating and comparing quotes and costs using theoretical formulas, it can be seen that in the first half of the year the profit margin at Hubei monoammonium phosphate plants had already fallen below the cost line and was in a loss-making state, with the highest loss approaching 70 yuan/ton. As of the end of June, the price of upstream sulfur at Changjiang Port had fallen to the lowest level in half a year at 670 yuan/ton, liquid ammonia prices in the Hubei region were around 1850 yuan/ton, and phosphate rock prices remained stable at around 400 yuan/ton. Although costs declined, monoammonium phosphate transaction prices were low and remained in a state of inversion.
Trend chart of profit and cost for 64% diammonium phosphate at mainstream plants in Hubei in the first half of 2016
Taking the Hubei region as an example, by calculating and comparing quotes and costs using theoretical formulas, it can be seen that in the first half of the year profits at Hubei diammonium phosphate plants were better than those for monoammonium phosphate. Judging from mainstream price levels, they did not fall below the cost line. However, market prices were relatively chaotic due to sluggish demand. Some plants with high inventories or financial difficulties, in order to recover funds as quickly as possible, did not rule out transactions below market prices. But compared with the export port price of about 1998 yuan/ton, domestic diammonium phosphate prices still retained some profit.
Based on the above analysis, the author is not optimistic about the future phosphate ammonium market. First, in previous years, after May should have been the peak season for international demand, and export volumes should also have continued to increase, yet China's port inventories are still increasing, and few new export orders have been heard of. It is reported that India's port inventory is around 2 million tons, and its purchasing enthusiasm remains low. Second, although autumn high-phosphate fertilizer use can be at least twice that of summer fertilizer use, under overall overcapacity it still accounts for only a minority, and current social inventories are still not small. Guizhou Wengfu's inventory in the Shandong market alone is about 90,000 tons. Finally, the winter storage market that everyone looks forward to has also been gradually shrinking in recent years. Perhaps it may bring some boost to the sluggish market at that time, but based on last year, it will be difficult to reach the volumes people expect.
In summary, under a sharp reduction in export volumes and suppression by low prices, even if autumn fertilizer use and winter storage diammonium phosphate market shipments improve, the market may see a turning point, but a large increase will still be difficult. Monoammonium phosphate and diammonium phosphate may rise by only around 50-100 yuan/ton.
Potash Fertilizer Market Summary
Introduction: Time passes like flowing water, and half a year has passed in the blink of an eye. In the first half of 2016, the potash fertilizer market saw mixed rises and falls, and the market situation of supply exceeding demand still has not eased. In January-February, overall demand was weak, market transactions were very few, and the trend was downward, with the market quiet throughout. In March-May, downstream factory fertilizer demand showed a small peak, but after the demand passed, the market quickly entered a dull period.
1 Market Review
Half-year domestic potassium chloride price trend
In terms of potassium chloride, port supply has been consumed down to about 1.6 million tons so far in the first half. Although overall prices have declined, dealers still have a relatively strong awareness of supporting prices; total border trade cargo volumes are relatively low. Apart from normally meeting the needs of the Northeast market, only a small amount was shipped out, mainly to the Shandong and North China markets, with prices maintained at low levels and shipments relatively smooth. China's self-sufficiency in potassium chloride increased slightly, with output up about 12% year-on-year in the first half of last year, and coupled with port inventories remaining at high levels, China's potassium chloride has consistently been in a situation of supply exceeding demand. In particular, the annual major contract that the industry pays close attention to still has no conclusion, and rumors suggest it may be at CFR 200 USD/ton, with signing expected at the end of this month or early next month. The wait-and-see atmosphere in the industry is fairly strong.
Half-year domestic potassium sulfate trend
In terms of potassium sulfate, after the Chinese New Year SDIC Xinjiang Luobupo raised its 51% powder price by 50 yuan, intending to drive the overall sluggish potassium sulfate situation, but actual conditions showed that shipments were average and trading was lukewarm. However, Mannheim plants in various regions did gain psychological support. Affected by spring plowing, market trading gradually improved, and producers' shipments were relatively smooth, especially granulated product sales, which performed well. But as spring plowing fertilizer use ended, the market entered the off-season, demand shrank, producer inventories began to increase, and sales pressure gradually grew. A continued decline in potassium sulfate prices became an industry consensus. As of the end of June, the price of 50% powder from the Mannheim process had fallen to 2250 yuan/ton, basically near the cost line.
2 Second Half Forecast
Potassium chloride
In early July, the potassium chloride market was basically stagnant. Large domestic potassium plants operated relatively steadily, while small plants remained in maintenance and had no plans to resume production. Salt Lake Group officially maintained its earlier relatively high quotes, with actual transactions in various regions mostly at 1900-1950 yuan/ton and volumes not large. On the port side, large dealers restricted sales of supply, and prices were relatively stable: 62% Russian white powder at 2070-2100 yuan/ton, white crystal at 1950-1980 yuan/ton, and 60% Russian red at 1800 yuan/ton. It is reported that bonded zone supply has exceeded one million tons, and uncertainty over the major contract has meant the supply cannot yet be sold after landing. In border trade areas, July supply will arrive around the end of the month, and pre-sales are reported to have already begun, with 62% Russian white crystal quoted at 1720-1750 yuan/ton. Based on the current market, here is a forecast for the potassium chloride trend in the second half of the year.
1. On the supply side, it is reported that in the first quarter of 2016, Uralkali's total potassium chloride output was 2.6 million tons, down 100,000 tons year-on-year, mainly due to the poor overall market environment. Despite having already adopted production restriction measures, by the end of March the company's potash inventory was still 350,000 tons higher than in the same period of 2015. China's cumulative potash output from January to May was 2.412 million tons, an increase of 11.7% from 2.159 million tons in the same period last year. In addition, bonded zone supply at ports has exceeded one million tons, and once the major contract is signed, port inventories will still be at a peak. Overall, although the international potassium chloride market declined slightly, overall inventories remain relatively large, and domestic output has continued to increase.
2. On the demand side, the launch of the autumn fertilizer market in July and August will drive demand for raw materials, shifting from dull to brisk. However, because wheat prices have declined, grassroots fertilizer use will be affected to some extent, so dealers mostly hold cash and wait and see. Moreover, autumn fertilizer raw materials are mainly phosphate ammonium, causing compound fertilizer producers to be inactive in stocking up on potash. As this year's low grain prices and planting structure adjustments will inevitably affect farmers' enthusiasm, it is expected that demand in the potassium chloride market in the second half of this year will not be higher than in the same period last year.
Potassium sulfate
In early July, the domestic potassium sulfate market remained stable throughout, with no major changes. The operating rate of Mannheim plants remained at around 50-60%. Although a few enterprises had plans to resume production, the scale was limited and did not provide much support to the market. Producer quotes remained firm, but actual transactions were lower. At present, the mainstream factory price for 50% powder is 2250-2300 yuan/ton. Qinghai water-salt system powder prices are around 2100 yuan/ton, with discounts of about 50-80 yuan/ton, mainly negotiated based on volume. The resource tax began to be levied on an ad valorem basis in July, noticeably reducing costs for resource-based enterprises, but SDIC Luobupo stated that before the plant resumes production, there will temporarily be no price adjustment plan, and it will maintain a delivered quote of 2350 yuan/ton. Based on the current market, here is a forecast for the potassium sulfate trend in the second half of the year.
1. On the supply side, in the first half Mannheim-process plants overall operated at 50-60%, capacity was relatively sufficient, and some enterprises still had inventories. SDIC Luobupo's output was stable, with planned production this year at around 1.6 million tons. Qinghai resource-based plants operated normally, but hampered by the poor market, capacity release was relatively slow.
2. On the demand side, after mid-July autumn fertilizer gradually enters production, and demand for potassium sulfate will slowly recover. However, prices for cash crops are low, farmers are not active in fertilizer use, and the state is reducing tobacco planting area. Overall, the possibility of a large increase in potassium sulfate demand in the second half of the year is not great.
In summary, the price trend of the potash fertilizer market in the second half of the year will still depend on changes in supply and demand. Whether there will be a turning point will still depend on whether downstream demand improves. It is expected that the potash fertilizer market trend will stabilize in the second half of the year. Once the major contract is signed, potash fertilizer volumes will gradually expand, and even if demand support remains, the downward price trend will be difficult to change.
(Source: Qianmo Ainong)
Dear chemical industry enthusiasts, follow me (WeChat ID: MOLBASE), and exciting information from the global chemical industry will continue to be delivered to you!