Automated pest and disease monitoring and forecasting enables full-process tracking, with forecasts that are both accurate and fast
Original title: How are pests and diseases predicted
Monitoring "counts insects," models "calculate trends"
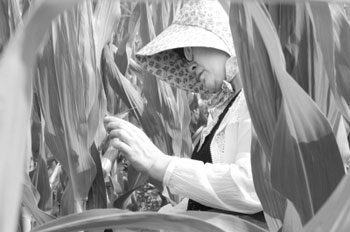
When it comes to pest and disease forecasting, the traditional image is often of a surveyor holding a small notebook, standing in the field counting insects. However, modern plant protection has long since entered the information age. Automatic data transmission and intelligent analysis make pest and disease monitoring and early warning more accurate and more timely, playing a greater role in reducing disaster losses and safeguarding food security.
"This year, pests and diseases are generally showing a trend of heavier occurrence." "It is expected that in the middle and late stages of late rice this year, pests and diseases will generally show a trend from heavier to severe occurrence." ... Every seemingly simple forecast result is backed by a large amount of data collection and analysis work --
-- Tracking the "full process" of pest and disease occurrence --
Reporter Li Jinghan
Collection
From surveyors counting insects one by one to remote fully automatic real-time monitoring
Quantity is one of the main indicators for judging the degree of pest and disease occurrence and spread. Liu Wancai, director of the Pest and Disease Forecasting Division of the National Agricultural Technology Extension Service Center, told reporters that in the past, if you wanted to know how many insects there were, you could only have surveyors check one by one. When pests and diseases broke out severely, there might be hundreds of thousands of insects in a single night. The work intensity was high, and data was easily lost. Now, the application of modern information technologies such as the Internet of Things and computers has made automatic collection of monitoring data a reality.
The automatic insect situation forecasting lamp is one of the latest "magic weapons" for grassroots surveyors. Although its appearance is the same as the insect-killing lamps used for control, the lure core is completely different. Forecasting lamps require the release rate of sex pheromone lures to be balanced to ensure counting accuracy. It can automatically count the number of insects, and the data can be read anytime and anywhere. There is also a remote real-time monitoring system, which can be called the surveyor's "clairvoyance." It can reproduce field scenes in real time, so field conditions can be monitored at any time even when not on site.
Automated monitoring not only saves time and effort, but is also more accurate. Potato late blight is the first successful example of automatic real-time monitoring of crop pests and diseases in China. At present, the annual occurrence area of potato late blight in China is 30 to 40 million mu, accounting for about 40% of the planting area, and in severe cases it can cause 70% to 80% of yield loss. Field humidity and temperature are the most important meteorological conditions determining its occurrence and spread. Real-time monitoring of field climate can effectively guide late blight control.
"The core equipment for automatic real-time monitoring is a field microclimate instrument." Liu Wancai introduced that the climate instrument can collect various meteorological factors in the field in real time (air temperature and humidity, soil temperature and humidity, light intensity, rainfall, evaporation, air pressure, wind speed, wind direction), and automatically transmit, store, and statistically analyze them. Combined with the epidemic patterns of late blight, a prediction model can be established to predict its incidence and spread relatively accurately.
At present, this technology has been demonstrated and promoted in Chongqing, Gansu, Guizhou, Inner Mongolia and other provinces and regions, realizing automatic network transmission and simulated early warning of monitoring data. In 2012 and 2013, late blight epidemics occurred for two consecutive years in Gansu Province. Plant protection departments used the digital monitoring and early warning system combined with field surveys to effectively improve the timeliness and accuracy of forecasts.
Analysis
From wheat stripe rust strains in Gansu, derive the disease situation in Henan and Shandong the following year
Accurate forecasting is the foundation of pest and disease control. But how can we "foresee the future" and predict future pest and disease occurrence in advance? Liu Wancai said the secret lies in pest and disease monitoring and prediction models.
Stripe rust is a major disease on wheat. In the history of New China, there were three major outbreaks: in 1950 it caused 6 billion kg of grain loss, equivalent to a 45% yield reduction; in 1964 it caused 3.2 billion kg of grain loss; and in 1990 it caused 1.2 billion kg of grain loss. Now, losses have been successfully controlled at 200 to 300 million kg per year.
The reason stripe rust can be "subdued" is precisely that its epidemic patterns have been clarified and a prediction model has been established. The spread of stripe rust within China successively passes through the summering variable region, the winter multiplication region, and the spring epidemic region. The main summering region is in Longnan, Gansu and northwestern Sichuan. In autumn it reaches winter multiplication regions such as Hubei, southern Hunan, and the Guanzhong area of Shaanxi. In these two regions it causes little loss. It is not until the following spring when it enters major wheat-producing areas such as Henan and Shandong that it begins to spread and cause damage. Therefore, by grasping the earlier spread situation in the summering region and other areas, we can basically understand how stripe rust should be controlled in the main wheat-producing areas the following year.
Combining climatic factors and occurrence and spread patterns also allows dynamic monitoring and early warning of migratory pests. For example, rice planthoppers and rice leaf folders generally fly into China from Vietnam, Laos and other places in April to May, first "landing" in rice areas of South China, Jiangnan and southern Southwest China, and then migrating northward. Therefore, every March, Guangdong, Guangxi, Fujian and other places must begin pest monitoring, so as to guard the first pass for national rice pest and disease prevention and control.
In addition to empirical forecasting based on patterns, data analysis through computer models is also very important. The introduction of geographic information systems (GIS) has given pest and disease change trends a more scientific and intuitive method of deduction.
"Through GIS, the pest and disease dynamics for the coming week can be intuitively deduced." Liu Wancai showed reporters on a computer. On the screen was a map of China, with different colors marking the severity of pest and disease occurrence in different regions. Pulling a horizontal line on the map was like rolling up a blinds, making pest and disease change trends clear at a glance: areas where the color deepened would have more severe pest and disease occurrence in the future, while areas where the color became lighter would have less.
Release
From old-style telegraph machines in the 1980s to today's mobile phone clients
Liu Wancai has been engaged in pest and disease forecasting for more than 20 years. From when he first started working to now, he feels as if he has "swapped a bird gun for a cannon."
In the 1980s, in order to report pest and disease information more quickly, an old-style telegraph machine was standard equipment at every forecasting station, and every piece of data sent required checking telegraph codes character by character. From 1996 to 1998, the national pest and disease forecasting information computer network transmission and management system was launched. Although internet access was still by telephone dial-up, pest and disease information could also be transmitted through the network. From 2003 to 2005, the crop pest monitoring information system was developed. At the end of 2009, the major pest and disease digital monitoring and early warning system, which placed more emphasis on practicality, went online. It adopted a combination of online reporting and mobile client reporting. No matter where surveyors were, as long as they had a mobile phone, they could upload pest and disease information in real time.
At present, the monitoring and early warning system has a total of 151 report forms and 6,176 reporting items, of which 831 items are automatically calculated by the system. "In the past, a lot of valuable historical data was not accumulated. Pest and disease prediction models cannot do without data." Liu Wancai introduced that a database of rice, wheat, cotton and corn pest and disease forecasting materials from 2000 to 2014 has been built, with about more than 1.2 million forms and more than 15 million data entries; information on the occurrence and control of major pests and diseases from 2009 to 2014 has been entered into the database, realizing automatic processing and comparison of data systems across years.
"We have eight or nine large servers specifically for data storage, display and pest and disease forecasting. For this we also rented 50M dedicated optical fiber, and there is also a dedicated backup system to ensure data security." Liu Wancai was very proud when mentioning this.
The timely release of early warning information on major pests and diseases is also very important. "The release of forecasts must be at just the right time, not too early, and not too late," Liu Wancai said. Before 2000, information release was mainly through print media. After 2000, radio and television began to be introduced. In recent years, the application of new media such as the internet, mobile phones and WeChat has not only diversified release channels, but also enabled targeted release of pest and disease information through text messages and WeChat platforms. For example, rice planthopper information is mainly released to farmers in the south, while armyworm information is mainly released to farmers in the north.